Vaccines and Misinformation | How to interpret data on the effectiveness of COVID-19 vaccines
This article is part of a series presented by our partner SAS that explores the role of data in understanding COVID-19. SAS is a pioneer in the data management and analytics field.
If there’s one thing people want to know most about a vaccine, it’s this: Does it work?
So naturally, as COVID-19 vaccine clinical trials were being completed and vaccines were being considered for emergency use authorization, the numbers that featured most heavily in the news were efficacy rates.
The Pfizer-BioNTech vaccine boasted an efficacy rating of 95%, Moderna 94% and Johnson & Johnson 72%. But what do those numbers really mean? How can individuals use these numbers to make decisions for their families?
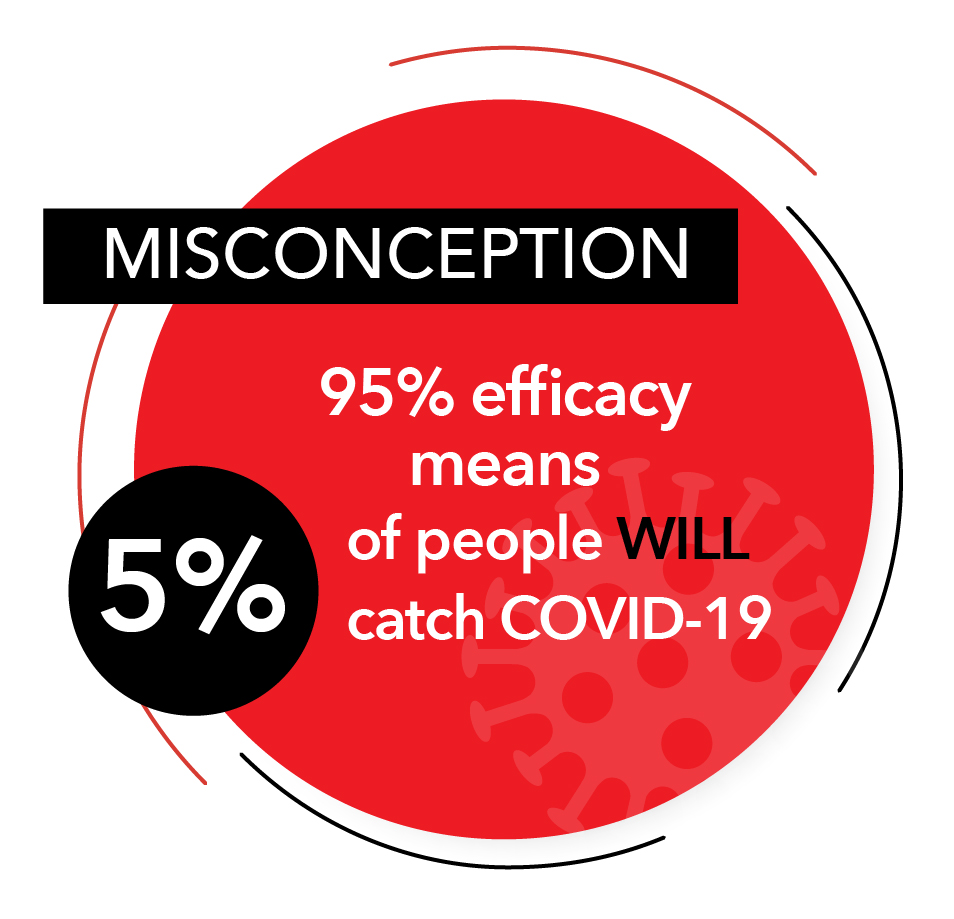
 One common misconception is that a 95% efficacy rate means that 5% of the participants in the trial contracted COVID-19, and that similarly, 5% of the vaccinated population will catch it as well. That is not the case. The purpose of the efficacy rating is to show how much the RISK of catching the disease is reduced.
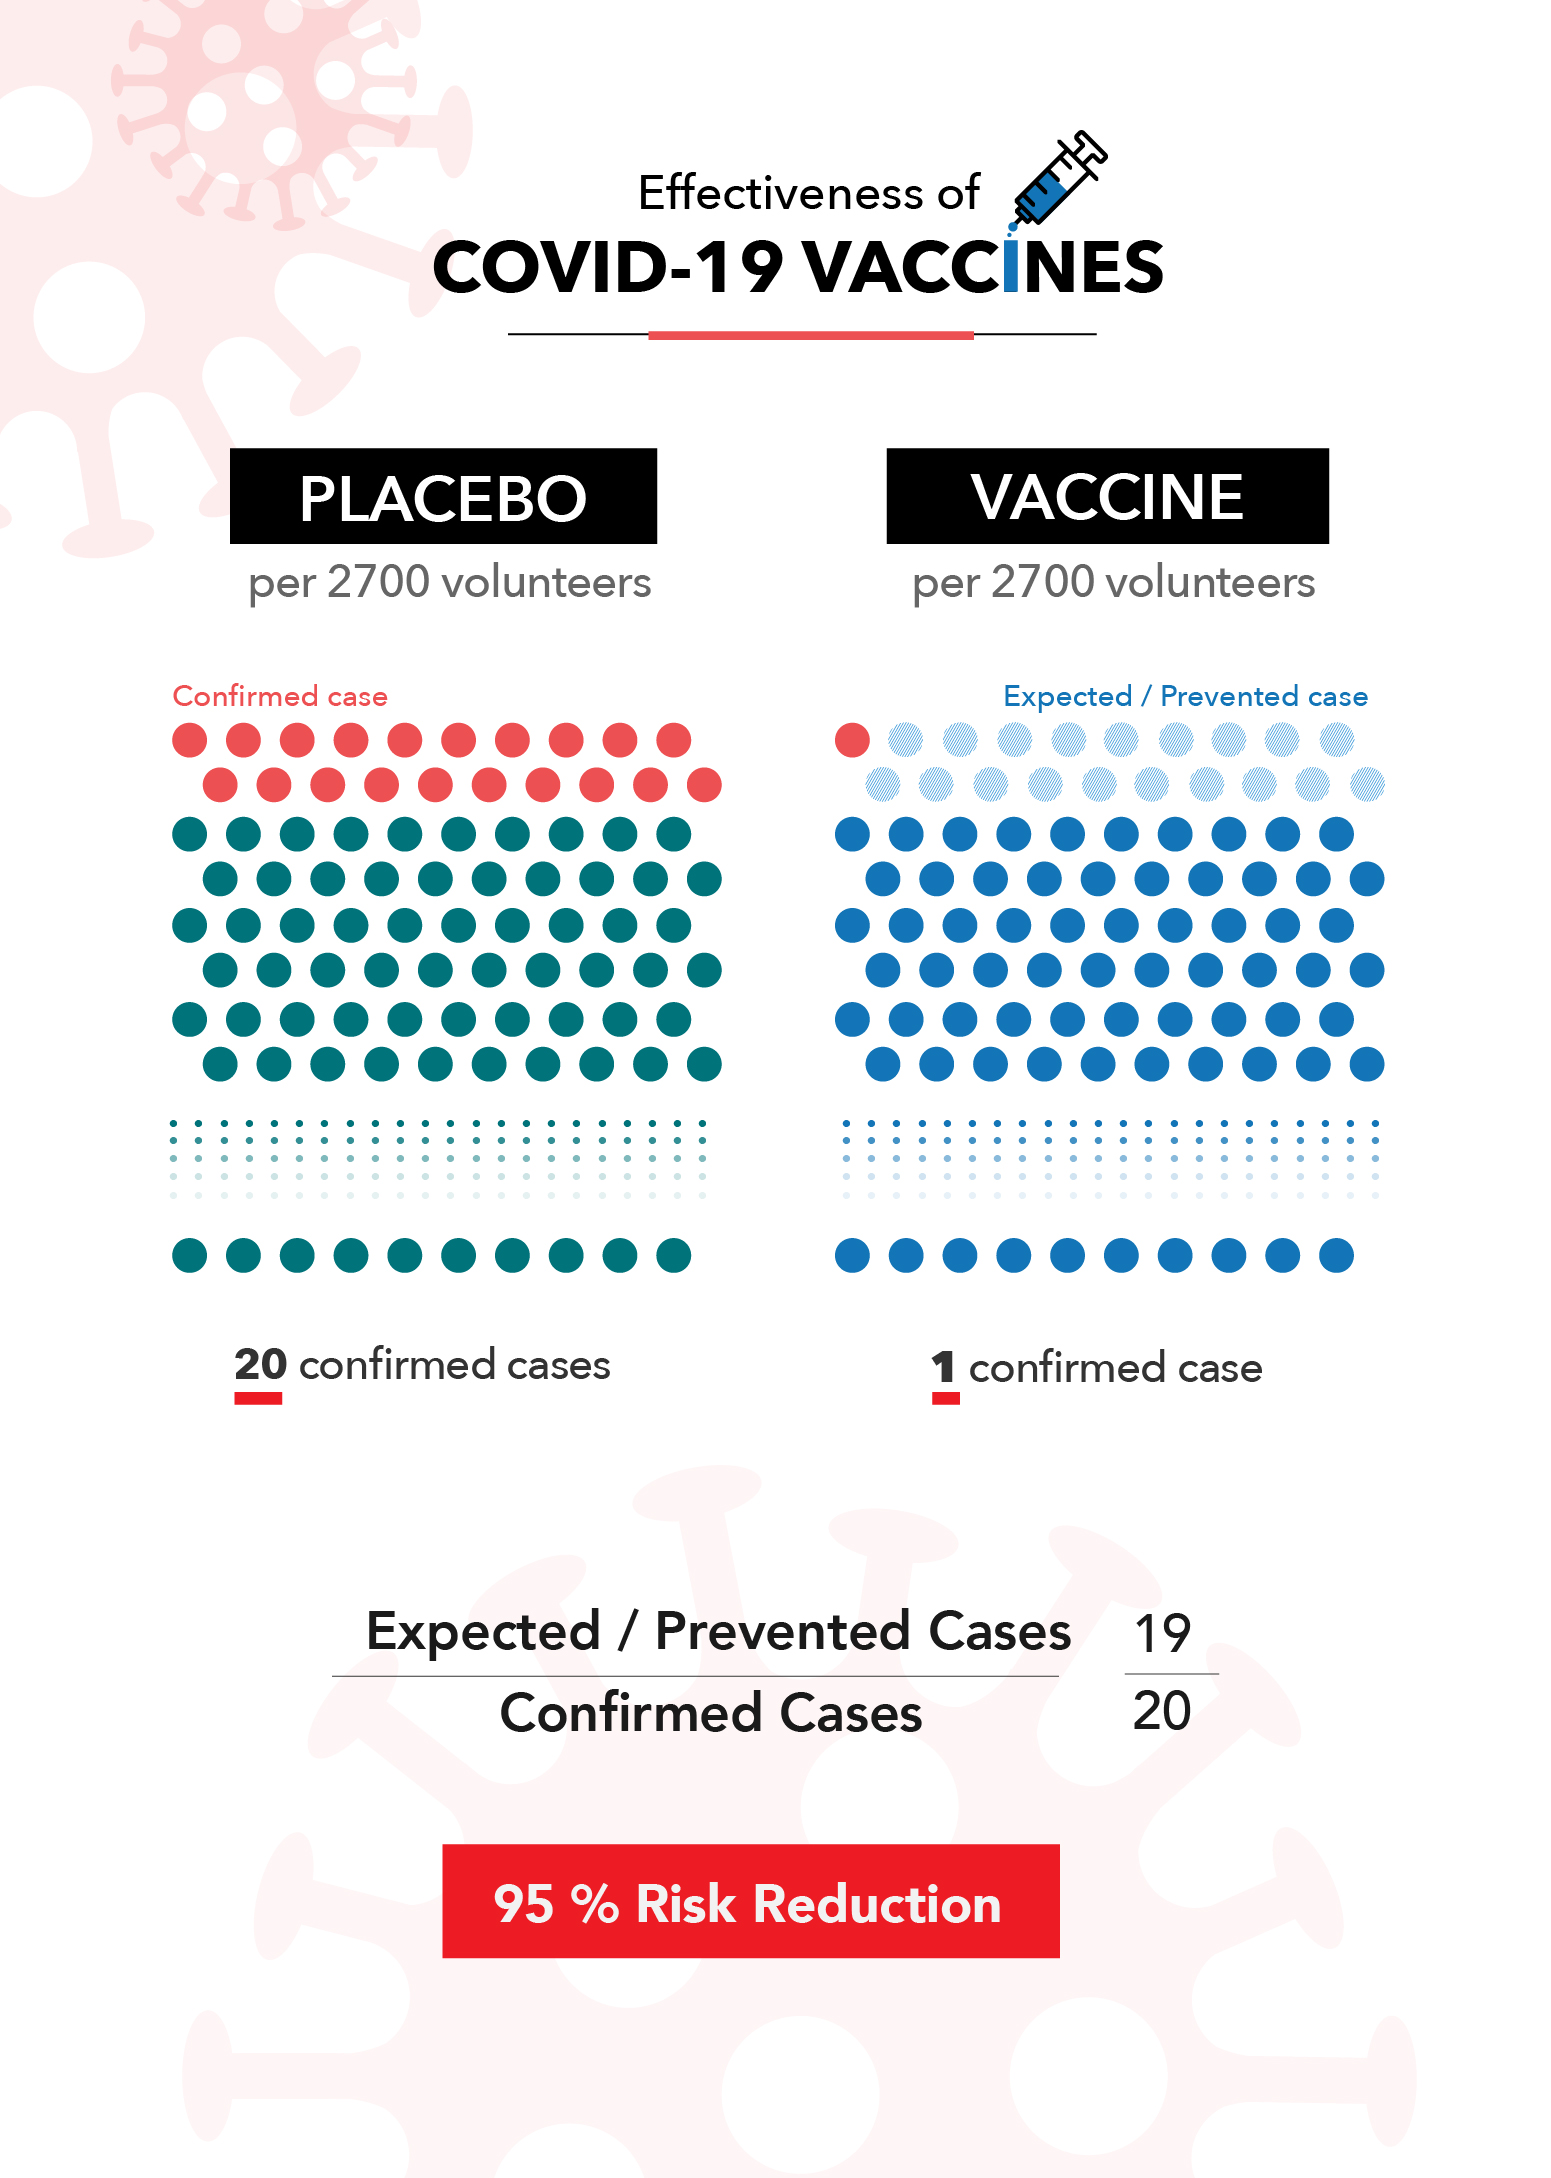
Let’s look at what this means using the Pfizer-BioNTech clinical trial. According to their released data, 160 out of the 21,728 people in the placebo group tested positive for COVID-19. Conversely, more than a week after receiving the second vaccine dose, only eight out of 21,720 people tested positive.
This means that over the course of the trial, it could be expected that the average unvaccinated person had a 0.7% chance of catching COVID-19. Alternatively, if you had received the Pfizer vaccine, you had a 0.04% chance of catching it. This is where their 95% efficacy rating comes from. It means that there were 95% fewer cases than would have been expected if the trial participants were not vaccinated.

Clinical trials can be hard to compare to one another because they occur during different time periods, in different places and have different definitions and criteria. This is a major reason health officials caution against comparing the efficacy numbers of different vaccines against one another. Small variances in the details of the trial can impact the final numbers.
The unique nature of clinical trials can also lead people to wonder how the vaccines perform in the real world, especially when issues like new variants come into play. Thankfully, we’re already seeing evidence that the real-world effectiveness of these vaccines matches up with the numbers reported in their clinical trials.
Now that a significant portion of the population is fully vaccinated, we can also examine recent, in-the-wild data to further understand how the vaccines reduce risk. We know that the vaccines aren’t perfect, and the CDC is actively collecting data on breakthrough cases (confirmed infections among vaccinated people).
As of April 26, the CDC reported 9,245 infections among the more than 95 million Americans who had been fully vaccinated. Using historical data* as a benchmark, an average of 264 vaccinated Americans tested positive for COVID-19 per day over the last two weeks of April. During that same period, the U.S. saw an average of 62,800 new cases per day among the entire population. That roughly equates to three cases per 1 million vaccinated Americans per day, compared to about 260 cases per 1 million unvaccinated Americans per day. It’s not perfect, but it represents a significant reduction in risk.
During that same two-week period, the U.S. recorded 8,926 total deaths due to COVID-19, 58 of which were fully vaccinated individuals. Given what we know about the size of the vaccinated and unvaccinated population, this means that vaccines likely saved at least 3,000 lives in those two weeks alone. The total lives saved is likely even higher, when one accounts for the fact that the demographics of the first groups of vaccinated Americans were among the most vulnerable for severe complications and death due to COVID-19.So what does all of this mean as you consider whether the vaccine is a good choice for you and your family? Getting the vaccine does not offer a guarantee that you won’t catch the disease or get seriously ill from it. But it does offer a very significant reduction of risk.
For example, consider that wearing seatbelts in a car is estimated to carry a 45% reduction in risk of death, and doing so is a choice most of us would make whether it was the law or not. Even if we believe our risk of an auto accident is low, we still make a conscious choice to further reduce the possibility of severe injury. Seatbelts don’t offer 100% protection, and neither do COVID-19 vaccines, but the data shows the added safety is worth it.
* As of May 14 the CDC has changed how they report breakthrough cases. Visit the CDC website for up-to-date information.
 About SAS: Through innovative analytics software and services, SAS helps customers around the world transform data into intelligence.

