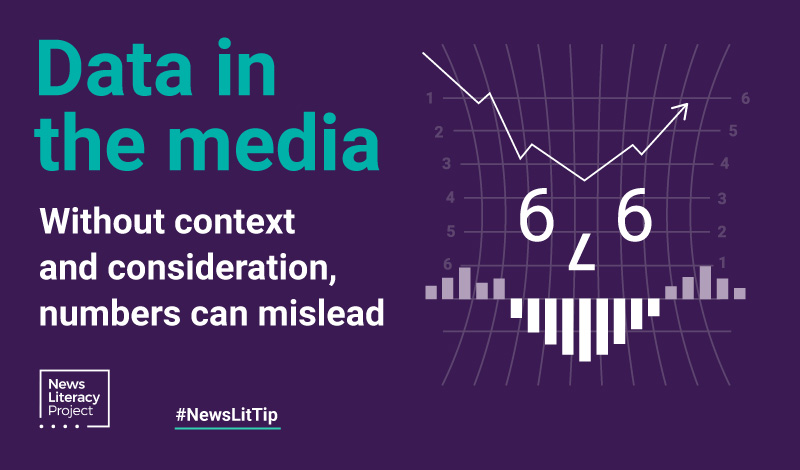
There’s a common phrase that “numbers don’t lie.” This refers to the idea that statistics and data that are used to back up arguments are faultless. But even when numbers and data are correct, people and organizations with their own agendas can use them to mislead because they don’t tell the whole story on their own.
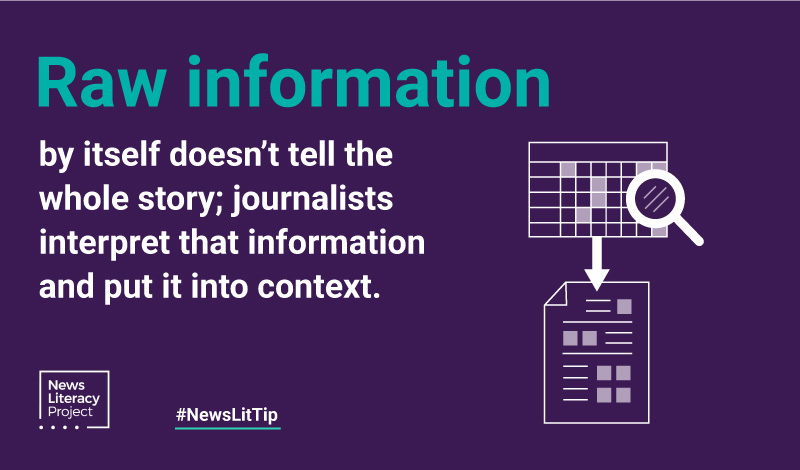
That’s why quality news organizations and researchers do more than just present data. They put it in context and explain how they collected it, analyzed it, built their database and made it verifiable. The Global Investigative Journalism Network provides some excellent examples of such work.
SAS, a pioneer in the data management and analytics field, helped us explain how we can transform data into intelligence and why numbers can sometimes mislead.
When we use numbers to represent the world around us, those numbers are almost always an estimate. We don’t know the exact number of people in the world at any given time, or the exact amount of carbon emissions, or how much money is being spent. Though it is theoretically possible to get exactly accurate values for these, the practicalities of our world mean we must rely on estimates instead.
And some issues can’t be quantified. For example, people’s preferences, health or behaviors are hard to boil down to a single number or value. How much do you like dogs? Do you eat healthfully? Is there a single value that can accurately capture the wide range of people’s answers to these questions? No.
That is why it is always important to understand the context in which data is collected and presented. What do the values you see truly represent? What do they tell you and what don’t they tell you? What is the person using the data trying to convey? Does the data support their argument?
Engaging in critical thinking around these questions will help you to be a better consumer of data. All kinds of information — including statistics, charts and graphs — can be presented in ways that mislead. That’s why you must evaluate them critically.
Data and numbers are powerful tools for building arguments. They add credibility and can help prove a particular point. They can provide insights into the world around us and help us better understand an issue. But the idea that numbers don’t lie is false.
So remember to evaluate data critically and pose questions of the information that could help you better understand what is presented, and lead you to wonder about the questions the data doesn’t answer.