Understanding COVID-19 data: Case fatality rate vs. mortality rate vs. risk of dying
This piece is part of a series, presented by our partner SAS, that explores the role of data in understanding the COVID-19 pandemic. SAS is a pioneer in the data management and analytics field. (Check out other posts in the series on our Get Smart About COVID-19 Misinformation page.)
Case fatality rate vs. mortality rate
COVID-19-related data and information can be hard to interpret if you’re not an expert. We have learned a lot of new terms in the last few weeks. One of the terms we see most often is case fatality rate, or CFR. This is an important metric because it helps us understand how many of those with a confirmed diagnosis of COVID-19 die as a result of the disease. However, like the comparisons mentioned previously in this series, this number must be considered in context.
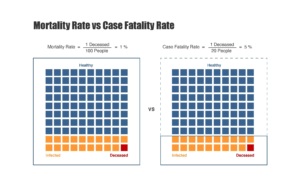
First, it’s important to differentiate case fatality rate from other metrics, such as mortality rate, or even a person’s risk of dying if they were to become infected. Case fatality rate is represented as a ratio.

Graphic courtesy of SAS.
Unfortunately, it is hard to measure both of these numbers with total accuracy. The number of people currently diagnosed with COVID-19 is not equal to the number of people that actually have it. And it’s possible we may never get an accurate assessment of that number. The current case fatality rate is likely elevated compared to the actual risk of dying if you were to catch the disease. That is because the people most likely to get tested are those with the worst symptoms, making them more likely to experience life-threatening complications.
Consider other factors
Underlying factors such as age and pre-existing health conditions make your individual risk different from the overall risk. And while certain reports of case fatality rates include some of those demographics as well, remember that those numbers have the same context-based biases as the overall case fatality rates.
Finally, a metric we are seeing less often, but still merits attention, is the overall mortality rate. This refers to the portion of the population that dies as a result of the pandemic. This number is typically very different from the case fatality rate because not everyone is exposed to the disease. Imagine a country with just 100 people in it. If 20 of those people got infected, and 1 of them died, the case fatality rate — the proportion of those infected who died — would be 5%. However, the mortality rate is only 1%. That is, 1% of the total population passed away.*
The takeaway here is to carefully look at the percentages you’re seeing reported and make sure you understand what population it applies to. Is it an entire population? Only those infected? Only those with severe symptoms? These are all important questions to ask yourself when interpreting the information.
Conclusion
There is a common perception that numbers and data are facts, but it is wrong to assume that they are a completely accurate picture of the world. The data we have are the best measurements available at the moment. The only way we could know for sure how the number of cases changes daily is if we could test every single person every day. This simply isn’t feasible, so instead we must rely on our imperfect measurements. This makes understanding the pandemic and its progression more challenging; but data analysis is still a powerful tool to give us insight and help us make decisions.
*The original version of this blog post included incorrect figures in the section discussing mortality rate vs. case fatality rate. They were corrected on April 14, 2020, the date of publication. We apologize for the error.
Other articles in this series:
![]() About SAS: Through innovative analytics software and services, SAS helps customers around the world transform data into intelligence.
About SAS: Through innovative analytics software and services, SAS helps customers around the world transform data into intelligence.